Monday 20 December 2021

Google Chrome SAP MDPGroup SuperEasy Extension for SAP CPI /SCPI

SAP MDPGroup SuperEasy Extension:

In Google Chrome, Go to the three dots on the right top -> More Toole -> Extension.

Search for extension "CPI Helper" -> Add to chrome


MDPGroup SuperEasy Extension adds UX improvements and features to SAP Cloud Platform Integration Web UI

Features:

-System Logs Viewer that shows last lines with a quick refresh 
-Simulation mode automatically persists input headers and body. You can also extract or fill JSON data. 
-Partner Directory User Interface 
-ProcessDirect and JMS Dependency Graph for Flows 
-Groovy Syntax Checker 
-MPL CustomHeaderProperty Search 
-Settings for enabling/disabling extension features on regular CPI UI


Google Chrome extension for SAP CPI Helper /SCPI

SAP CPI Helper: 

In Google Chrome, Go to the three dots on the right top -> More Toole -> Extension.

Search for extension "CPI Helper" -> Add to chrome


Features of it:

Extends the SAP Cloud Platform Integration with some useful features to improve usability.
CPI Helper Chrome-Extension

This Chrome Plugin extends the SAP Cloud Platform Integration with some useful features. It includes a button to activate traces and a message sidebar directly in the Integration-Flow-Designer.
As SAP is not well known for it's usability it was time to integrate some features ourselves.

Features
Integration Flow Designer Improvements:
- Sidebar with processed messages
- Activate InlineTrace to see message route in integration flow designer
- Directly see trace messages in integration flow designer
- Pretty print for trace messages in integration flow designer
- Button to switch on trace
- Directly go to traces of specific message
- Directly go to logs and attachments of specific message
- Pop-up with error-message when hovering message in sidebar
- Pop-up with deployment info
- View and delete variables in info pop-up


Useful features in iflow on SAP CPI/ SCPI

While developing the objects in the SAP CPI iflow, we might not aware of or notice some features as a beginner. I can show some features which you can utilize it.

1. View the deployment status in the iflow development screen:

      Earlier we used to view in the manage integration content on Dashboard. Now we can view directly in the iflow development screen.

Can view deployment status such as Run time status,Deployed By, Deployed On, Deployed version


2. Copy the configuration from one palatte to others

     1. To copy the palatte object with its configuration


      2. To copy the adapter configuration:

3. Simulation mode for testing the mapping


        Test the mapping by importing the input data in xml format.


4. Run the complete iflow internally.

        Note:  It won't work on the timer flow.

        1. Start the simulation from where it needs to be tested


        2. End the simulation to where it needs to be tested.


      3. Start the simulation run using the below button:


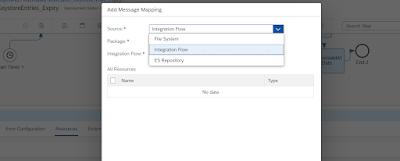
5. Import the mapping from the local machine or from other iflows.

      1. Click outside of the integration flow, then go to resource tab below.

      2. Select the mapping/scripts which you want to import from other flow/local machine


6. From the monitoring screen, we can direct to iflow and can view / edit the artifact(iflow)