How to view the version/ build of SAP CPI,
1. Login to the tenant and right corner click on the account profile icon
2. On the dropdown click on "About"

How to view the version/ build of SAP CPI,
1. Login to the tenant and right corner click on the account profile icon
2. On the dropdown click on "About"

MDPGroup SuperEasy Extension adds UX improvements and features to SAP Cloud Platform Integration Web UI

Features:
-System Logs Viewer that shows last lines with a quick refresh
-Simulation mode automatically persists input headers and body. You can also extract or fill JSON data.
-Partner Directory User Interface
-ProcessDirect and JMS Dependency Graph for Flows
-Groovy Syntax Checker
-MPL CustomHeaderProperty Search
-Settings for enabling/disabling extension features on regular CPI UI
SAP CPI Helper:
In Google Chrome, Go to the three dots on the right top -> More Toole -> Extension.
Search for extension "CPI Helper" -> Add to chrome

Features of it:
While developing the objects in the SAP CPI iflow, we might not aware of or notice some features as a beginner. I can show some features which you can utilize it.
1. View the deployment status in the iflow development screen:
Earlier we used to view in the manage integration content on Dashboard. Now we can view directly in the iflow development screen.
Can view deployment status such as Run time status,Deployed By, Deployed On, Deployed version
2. Copy the configuration from one palatte to others
1. To copy the palatte object with its configuration


3. Simulation mode for testing the mapping


4. Run the complete iflow internally.
Note: It won't work on the timer flow.
1. Start the simulation from where it needs to be tested


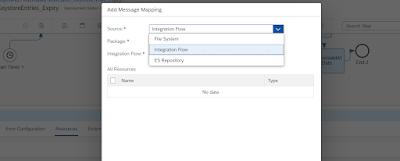
5. Import the mapping from the local machine or from other iflows.
1. Click outside of the integration flow, then go to resource tab below.
2. Select the mapping/scripts which you want to import from other flow/local machine
6. From the monitoring screen, we can direct to iflow and can view / edit the artifact(iflow)

Groovy script
import com.sap.gateway.ip.core.customdev.util.Message;
import java.util.HashMap;
import groovy.json.*;
import groovy.util.logging.*;
import org.codehaus.*;
def Message processData(Message message) {
def body = message.getBody(java.lang.String) as String;
def XmlDataObject = new XmlSlurper().parseText(body)
def xmldata = []
def s="";
XmlDataObject.'**'.findAll { it.name()== 'UserServiceTransactionProcessingTypeCode'}.each { a ->
xmldata << a.text() }
message.setProperty("StatusCode",xmldata);
def newxmldata = xmldata as String[]
newxmldata = newxmldata.contains("ZCW1")
message.setProperty("StatusCode1",newxmldata);
return message;
}
Pick the xml field from the huge payload and remove square brackets.
Groovy Script:
We have a better feature in SAP CPI to enable the trace using the chrome plugin instead of changing the log level in the manage integration content.
To enable the chrome plugin "SAP CPI Helper":
1.Chrome browser -> Settings -> Extension -> Left top corner click three lines near to Extensions.
2. Below can see Open Chrome webstore -> Serach for "SAP CPI Helper"
3. Install it and can reopen the browser
4. Logout and login to the CPI tenant -> Go to Iflow developer page.
5. Can see the new option at right top corner as "Trace, Message, Info"
6. Here you can enable trace and when you change and deploy, the trace will be automatically activated.
This is a useful feature for the developer. Hope this helps, please do comment.